

Create a Simple 'Vitals Dashboard' in Google Analytics

Access the important stuff without the faff!
I've previously written a basic guide on how to set up Google Analytics on your website, but it can be a bit overwhelming once everything is set up and you're faced with a huge sidebar of options and no idea where to find the information that's important to you!
Heck, I don't know what to do with half the information Google Analytics provides, and trying to sift through it all to find useful metrics is a real pain.
This is where dashboards come in; they are your own personal space to display key information that is important to you and your business. Having your own personalised dashboard means you don't have to go faffing around with any of the other sidebar areas or options - everything you need is in one space.
How do You Create a Dashboard?
Firstly, log in to your Google Analytics 'Reporting' section, and click the sidebar option labelled 'Dashboards'.

Here, you may see a 'Private' section (useful for if you have a large team accessing the same analytics information), but for now click 'New Dashboard' to create your own.

It will then ask you if you want to create a 'blank canvas' dashboard from scratch or use a pre-filled 'starter' dashboard. I recommend starting from scratch, or else you have the same problem of trying to wade through information that may not be relevant to you.

Once you click 'create dashboard', it will probably prompt you to create your first 'widget'. A widget is simply a metric (ie. a chunk of information) that displays in its own little box on your dashboard. I'll show you how to create these below:
Suggested 'widgets' for your dashboard
If you're not sure what information about your website will be useful to you yet, I've included 10 suggested widgets below (you can have a maximum of 10 per dashboard). Setting these up will help you get the hang of how to create widgets, so you can start experimenting with different information when you're ready.

The default analysis time period in Google Analytics is usually 30 days (this will show in the top right hand corner of your dashboard), so be aware that all widget information is based on 'monthly' information.
1. Unique Visitors (Metric)
This metric will tell you how many individual people are visiting your website, and is different to 'Views' or 'Pageviews' because one person could view a page several times.

To create this widget (as shown above), you can click '+ Add Widget' in the top left corner and input the below widget settings, making sure you choose 'Metric' in the options of how the information will display.

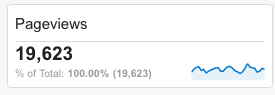
2. Pageviews (Metric)
As mentioned above, pageviews will tell you how many pages have been viewed on your site, including views by the same people. It's still an important metric as is shows how much visibility your website/content is getting.
To set up this widget, click '+ Add Widget' and fill in the below details:

3. Pageviews (Timeline)
The metric above will show you how many pageviews you've had within a defined time period (set using the date range in the top right-hand corner of the dashboard), but it can also be good to see how your pageviews have fluctuated over time too. This is where a timeline make a useful visual representation:

To create this, add a widget and input the settings below, being sure to choose 'Timeline' in the 'Standard' options:

4. New vs Returning Visitors (Pie Chart)
Want to know how many of your website visitors are new and how many are people who have previously visited the site? This is an important chart for you! It can be great to see what kind of loyalty people have to your website and content.

To create this widget, input the settings below, making sure to click the 'Pie' option:

5. Popular Content (Table)
This is one of my favourite widgets, because it shows me exactly which pages on my website are getting the most views, and this enable me to go back and improve those pages and add extra information for new visitors.

To create this widget, input the following settings, being sure to click the 'Table' option:

6. Visitor Locations (map)
It might be helpful for you to see where your website visitors are coming from to help you either tailor your content or switch up your marketing messages. Google Analytics has a fun maps graphics to show you this information visually.

To create this widget, input the settings below, clicking 'Geomap' in the Standard options:

7. Bounce Rate (metric)
Your bounce rate shows what percentage of visitors to your website leave your website after viewing just one page. This is important as it affects your SEO ranking, so you should keep an eye on how high it gets - mine has been pretty high this month unfortunately, but you should aim for it to be less than 55%.

To create this widget, input the settings below:

8. Pages per visit (metric)
As you may be able to guess, this metric is calculated by dividing your pageviews by your unique visitors; it shows how many pages on average your visitors are looking at before leaving your site. The higher the better, as it means people are interested in your content! (Again mine isn't great this month, oops!):

To create this metric, input the settings below:

9. Page load time
The higher this is, the worse the experience for your website visitors, and it also can affect your SEO as well. The metric is shown in seconds, and ideally you want it to be less than 3 seconds - however as you can see mine had a big leap this month; probably due to some plugins I've been using.

To create this widget, input the settings below:

10. Traffic Source (Pie Chart)
This is another favourite widget of mine; it shows exactly where your website visitors are coming from, which helps you to analyse how successful your marketing is in each area (eg. Pinterest marketing, SEO, Facebook etc).

To create this widget, input the settings below, selecting 'Pie':

Remember, you can rearrange your dashboard by clicking and dragging each widget into a different column. You can set the number of columns by clicking on the 'Customise Dashboard' button in the top right corner:

